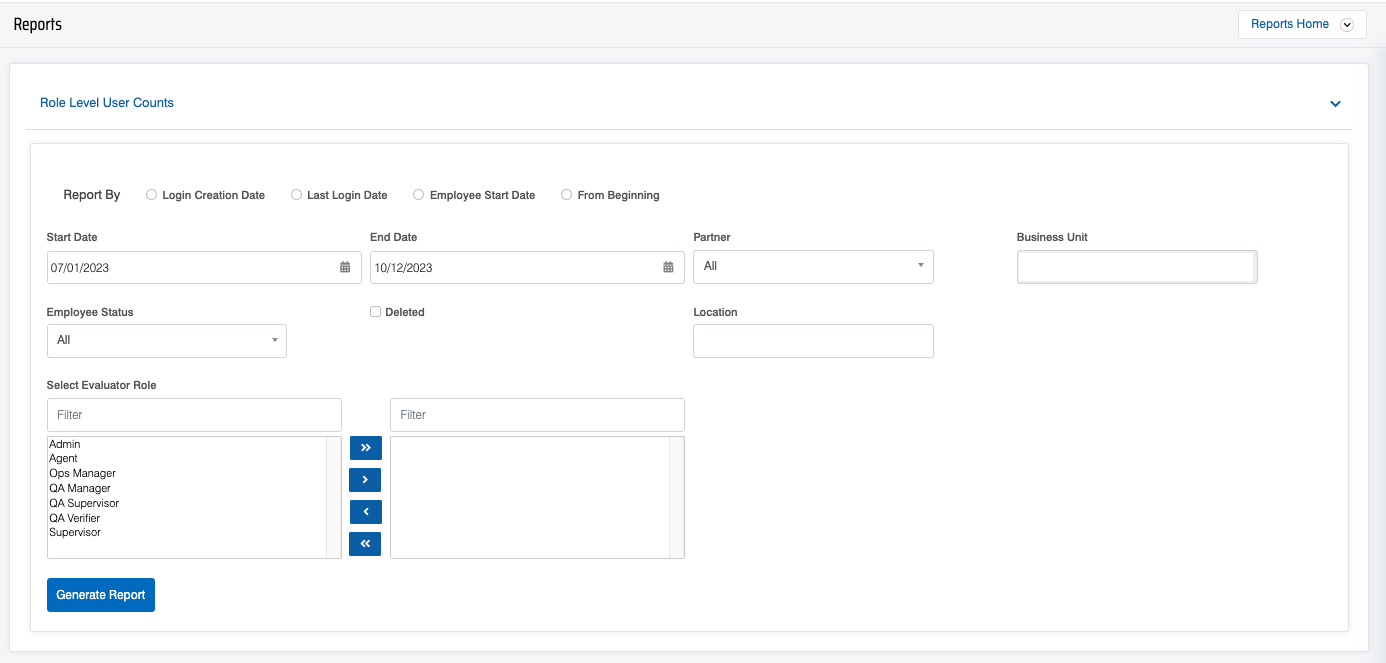
Role Level User Counts Report displays the number of users assigned to User roles in QEval.
To view this report, select Reports > Report > Role Level User Counts as shown below:
 The following page will be displayed.

|
Screen Elements |
Description |
|---|---|
|
Report by |
Login Creation Date: Select this radio button to display the details based on the login account creation date. Last Login Date: Select this radio button to display the details based on the last login activity. Deleted: Display details of all deleted users. Employee Start Date: Select this radio button to display the list of employees based on their start dates. From Beginning: Select this radio button to display the list of all employees whose accounts have been created from the beginning to date. |
|
Start Date |
To set the date range, firstly, select a start date. |
|
End Date |
Select the end date. |
|
Partner |
Select the Partner name from the dropdown list which will display the different names of Partners. |
|
Business Unit |
The client name will be selected and displayed in read-only mode as the business unit from the dropdown list. |
| Employee Status | Select the employment status from the dropdown list as – Active, Inactive, or All. |
| Deleted | Select this checkbox to view the data for deleted users. |
|
Location |
Select the required location from the list |
|
Evaluator Role |
Select the required Evaluator role from the left-hand side box which will display the list of all the user roles of higher order. One can also search the roles by entering the role’s name in the Filter field. Once the role(s) is selected, click on To move all the roles to the right-hand side box at once, click on To remove a few roles from the right-hand side box and move them back to the left-hand side box, firstly, select such roles and then, click on To move all the roles from the right-hand side box to the left-hand side box at once, click on |
Once the search criteria are set, then, click on the ![]() button.
button.
The report for the set criteria will be displayed in tabular as well as in the pie chart format as shown below:
 One can export the report displayed in Excel and CSV formats. To do so, click on the
 and
to download the report in respective formats.
Video